Living with a superbike: 5 years of owning & maintaining a Ninja 1000
The average running cost of the Ninja 1000 has been around INR 14.3 per kilometre of usage over the years.
BHPian KarthikK recently shared this with other enthusiasts.
Time flies. It really does. Five years have flown by since the Ninja 1000 has been a part of our lives. It just feels like yesterday that we were excitedly taking an Uber cab to the Kawasaki showroom to receive the delivery of a litre class sport tourer bike that we so fondly desired to add to our garage to enhance our travel experiences.
While I have been touring on bikes since 2008 with friends or solo, our erstwhile Karizma helped to set the ball rolling when it came to 2-up touring on bikes with my better half from 2015. Getting the Ninja 1000 in 2018 was a big step up for us to change our (predominantly car-biased) way of touring, to exploring travel in a different light – on a not-so-practical, high-power sportbike. It is a different matter that we later expanded our touring bike arsenal to include the RE Himalayan and later the Honda CB500X to maximize our touring capabilities and remote location reach and enjoy this (road tripping-on-bikes) hobby much more comprehensively for our tastes.
Fast forward 60 months, and I have to say the Ninja has not only met all the dreamy and rosy expectations we had of this ownership and travel style of sport-touring, it also surpassed most of them and never failed in putting smiles across our faces every time we took it out for a trip.
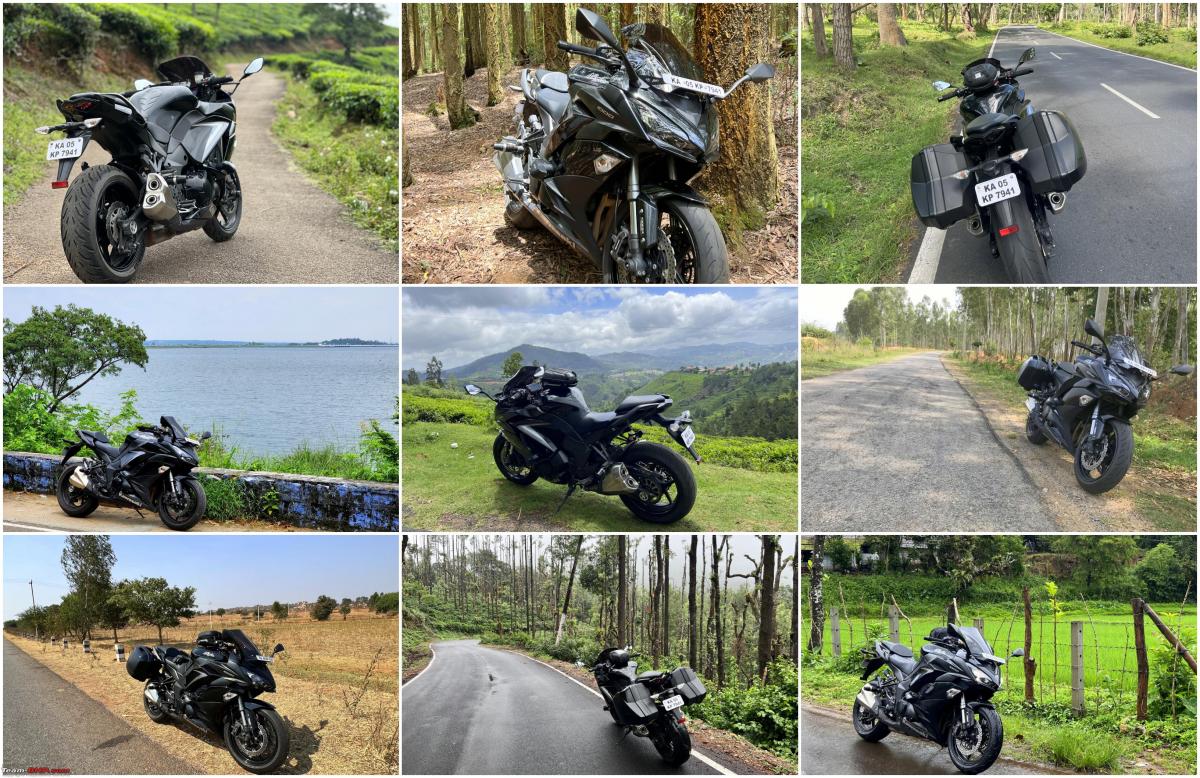
I’ll just infuse this post with some lovely collages of memories accumulated over the years, along with some useful statistics and useless statistics too. Maybe some of the expense-related statistics and splits will help to provide some insights into ownership costs of a big bike in this genre for readers seeking out information on those aspects. In general, I tend to collect tons of usage-related and travel-related data mostly because I like doing so, to observe and infer patterns from historical data later. I’ll probably add some brief inferences from each set of the data gathered. Some of it may seem ridiculous, so feel free to call me crazy, laugh at the posts and move on.
The Ninja has conquered almost all types of terrain in the southern part of the country, barring maybe hardcore off-road trails
Mountains, beaches, forests, grasslands, tea or coffee plantations, lakes, rivers and everything else in the geography textbook and the Ninja happily munched through them for breakfast
Gathering statistics on the total usage of the Ninja over the past five years, split by genre.
~70% of the Ninja’s usage came from 2-up trips with the wife, while the remaining came from day trips and group rides. This trend has been shifting a bit more over the past few years and will continue to let the 2-up sector take up a bit more percentage of the pie-chart going ahead.
This bar chart shows the trends of usage in terms of kilometres covered per year. 2018-19 was my very first year and I was still evolving as a rider, plus had some personal challenges when I lost my dad. 2019-20 and 2020-21 were the COVID-era pandemic years and many rides had to be cancelled, shelved or postponed due to the uncertainty with numerous lockdowns and restrictions, the lesser said of that era the better. In 2021-22 and 2022-23, the usage has picked up pace and should remain steady from now on.
An interesting observation when looking at the cumulative rides done across months of the year –
- April has usually been a lean month because we don’t like to deal with excess tourist traffic everywhere (summer vacation season of the month).
- August and December are usually the months when we prefer to use the ADV bike (such as Himalayan / 500X) to do some long inter-state rides or monsoon rides. Anyway, it is funny to see such splits and decipher something from filtering historical data.
We have met so many interesting people and made lots of new friends over the years, and I have certainly learnt a lot from riding with so many experienced and skilled riders from all walks of life – all thanks to this one bike. So many wonderful rides and memories created during all the lovely rides done with so many BHPian biker friends over the years, notably ebmrajesh, CrAzY_dRiVeR, rbp, neil.jericho, deepfreak15 and Shaikhmimran who have been part of almost all of our group rides over the years.
The better half is the one who usually does all the R&D for finding lovely properties and comes up with brilliant itineraries based on specific vehicles in our garage. Most of the trips and travelogues on this thread are possible thanks to her meticulous behind-the-scenes work in suggesting and selecting beautiful offbeat properties in apt locations based on the season of the year for every vehicle in our garage, Ninja included. Kudos to her for being a massive part of the Ninja ownership story!
This pie chart has splits of all our rides done so far, split on genres.
- Nature and Luxury retreats form major chunks of our trips so far. There is obviously some overlap across some sectors, but when costs cross a certain threshold on my database those trips get classified as luxury retreats even if they belong in some other sector, lol!
- Historical / Heritage locations also have been a mainstay more recently.
- Group trips are rides done with friends where we mostly reach a quaint destination and relax and chit-chat amidst the group.
- Going forward the goal should be to expand to other lesser-used sectors such as more food-trail trips and adventure destinations, etc to evenly distribute the splits across all categories in the days to come.
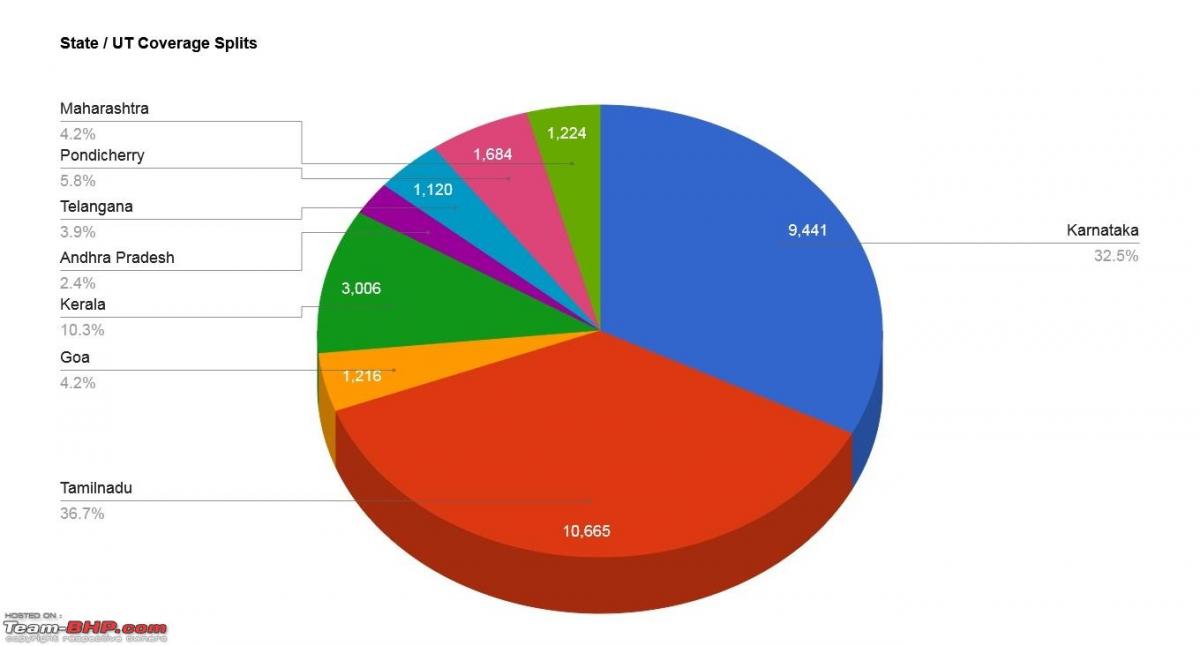
Another probably silly split of data filtered based on states as destinations of the trips.
- Karnataka and Tamilnadu have probably grabbed the lion’s share of the pie chart here, and quite reasonably so because they both offer a ton of varied destination genres for the discerning travellers in us.
- There have been sporadic trips to Hyderabad (Telangana), Kolhapur (MH) and one to Goa earlier during the ownership period. Although tracking has been going on from Day 1, many of the earlier rides have no travelogues on the thread because I wrote this thread only in late 2020, and have been posting only major rides from 2021-22 onwards. Anyway, this is how the total state-wise coverage split looks after 5 years. The goal should be to reduce rides in KA and TN states and expand more of the other lesser-covered sectors in the days to come, to help even out the splits across all sectors.
Moving on to the expenses part of the statistics accumulated over 5 years – here is a table outlining the insurance costs over the years. The first year’s premium was obviously higher because of the high IDV at purchase time, and the mandatory 5-year third-party cover bundled into the first year’s premium at purchase time. After this, the premium has been progressively reducing thanks to NCB accumulating over the years (there have been no claims obviously) and the IDV will anyway be reducing a bit every year with age.
Tracking the insurance premium over the years, this is how it looks. The sixth-year premium is yet to be included in the previous table, but the slight bump in year 6 is because the 5-year third-party cover is now over and third-party coverage will become a part of every year’s premium going ahead. I believe this third-party cover is around ~2800 INR per year for bikes above 350cc. I’ll update the insurance data for the 6th year once the renewal is done later this month.
Fuel costs over the years are indicated in the table below, sorted year-wise. The fuel costs have progressively increased over the years due to 3 reasons:
- Fuel prices in general were low (mid-70s INR per litre) during 2018-20 in the pre-pandemic era, while they increased after 2020-21 (100+ INR per litre)
- More touring and in general more usage after the pandemic era, more kilometres hence more fuel expenses
- My preference towards IOCL’s XP100 wherever available has bumped up the fuel costs because that thing costs 160 bucks per litre, lol!
Some useless data splits now for laughs – this one shows all fuel filled in the Ninja from Day 1 till today.
- 2018-20 I used to prefer HP’s Power99 or BPCL’s Speed 97 whenever possible. Regular fuel or shell would be used only when out touring without those premium fuels available.
- From 2020 onwards this entire trend changed when IOCL brought in XP100 and XP95, both of which are available quite widely in the south now. Needless to say, almost all my usage recently is only with either of these 2, with XP100 always being preferred for the fantastic throttle response, full-fledged power output (lower octane causes a reduction in tune) and fantastic refinement.
- The IOCL XP twins are only going to hog more of the pie-chart sector space in the days to come, with more widespread availability increasing our touring abilities to every nook and corner of places which we intend to comb in future.
Coming to Tyres – the bike has fully used up 2 sets of tyres and is currently on the third set of tyres. The table below highlights the usage-level splits by genre, of all 3 sets of tyres used so far.
If the maintenance expenses have to be broken down to show the splits across tyre-replacement-related expenses, routine services, wear-and-tear part replacements and incidental expenses, this is the split chart. 2 sets of tyre replacements together take the majority of this chart over 5 years, showing just how expensive tyres have become for this genre of tyres.
If I were to track the trends of overall service expenses including even tyre replacements over the last 5 years, this chart shows a clear picture of that.
- The fifth-year has been expensive compared to the other years because there were more routine maintenance activities and age-related replacements done this year.
- I foresee some more increased maintenance expenses in 2024 when I will be preparing to replace the battery, the chain-sprocket kit and spark plugs along with the next routine service.
Grouping all the expenses together, here are the overall running costs of the Ninja 1000 over ~30,000 km and five years, taking into account fuel costs, insurance costs, tyre costs and maintenance costs. The average running cost of the Ninja 1000 has been around INR 14.3 per kilometre of usage over the years. This includes all 4 expense types.
If I plot all 4 constituent sets of ownership expense data on a graph, this is what I would end up with. Notable observations:
- The tyre costs cause peak once every 2-3 years and remain at zero in other years
- Service expenses (apart from tyres) have increased with usage and age because of more frequent mile munching over the years, but they should subside after the spark plugs, battery and chain-sprocket kit are replaced and the bike gets back to needing just oil and filter changes for another couple of years after that
- Fuel costs are directly proportional to the usage of the bike. Since touring has increased over the years, fuel expenses have also gone up. Bias towards XP100 usage has also bumped up this line a bit.
- Insurance costs (thanks to no claims) have reduced and eventually flattened out as expected. Hopefully, I never need to make any claim ever!
That concludes my five-year summary and recap of usage, memories and expenses over five years.
I liked this quote that I once came across on the net – We come into this world with nothing, we will leave with nothing. The only things we gather in life are memories, vivid memories of places and experiences which we will continue to hoard every time we travel and explore more of this world.
Looking forward to a lot more Sport-touring in the years to come, with this gem of a machine doing what it does best – helping us create tons of lovely experiences and memories as we continue to travel more.
Thank you for the exemplary service, the spirited riding experiences and the memories – Kawasaki Ninja 1000!
Check out BHPian comments for more insights and information.
Source: Read Full Article


