Councils refusing to pay-up for pothole damage to cars
27 per cent of drivers suffered pothole damage costing £7.5bn in repairs last year according to a survey, but councils paid out less than £1m compensation

The UK’s pitted, potholed and poorly maintained roads damaged the cars of nearly half the nation’s drivers in the last 12 months according to a new survey. Of the 45 per cent who reported damage to their vehicle 27 per cent blamed potholes specifically for issue they experienced and said it cost an average of £922 to fix.
The total damages bill caused by poorly repaired roads amounts to an estimated £16bn, with £7.5bn attributed directly to pothole damage, according to a survey of 2,000 drivers carried out by Censuswide for Halfords.
However, a freedom of information request also made by Halfords reveals only a tiny proportion of drivers are receiving the compensation they should be entitled to from the councils responsible for maintaining roads in a safe and usable condition.
-
 Pothole claims: how to claim for pothole damage to your car
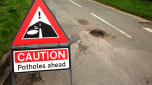 Pothole claims: how to claim for pothole damage to your car
According to council responses, around £900,000 in compensation was paid out in the last 12 months, with one – West Northamptonshire – rejecting all but one of the 849 claims it received from drivers and paying out just £148 in the period.
At the other end of the payout scale Wiltshire County Council covered the repair costs of 42 per cent of the claims it received. Nationally, says Halfords, only 13 per cent of claims receive any kind of payout.
“Motorists are literally paying for the Government’s lack of investment in our highways – at a time when few can afford it,” says Graham Stapleton, Halfords CEO.
“It’s not just about cost, it’s about safety, with nearly a quarter of motorists saying a pothole in the road has led to an accident or a near miss. Few things are more frightening than being presented with a huge pothole when travelling on a motorway at full speed – forcing drivers to make a split-second decision as to whether they can avoid it, or simply have to plough through it and hope for the best. And as the freedom of information request shows – even if they do make a claim, the chances of getting any compensation are minimal.”
Potholes cause a variety of damage to cars, but the most common incidents involve tyres at 46 per cent. Bent or cracked alloy wheels account for 25 per cent of issues, while 21 per cent of problems relate to windscreen damage and 20 per cent to brakes. Of the drivers reporting issues, 18 per cent also say the underside of their cars were damaged, with 9 per cent reporting chassis damage.
How much is your council paying out for pothole damage?
The table below shows the results of the freedom of information request made by Halfords. It gives details, from the councils who responded, of the amount paid out for damage to cars caused by road surfaces in poor condition in relation to the number of claims made.
Council District/County Council |
# of Requests for claims |
# Claims Paid |
Average £ paid out per claim |
Total paid out |
% Paid out |
West Northamptonshire Council |
849 |
1 |
£148.48 |
£148.48 |
0.12% |
Worcestershire County Council |
134 |
‘1-5’ |
/ |
£1,370.22* |
1.87%* |
Durham County Council |
116 |
2 |
£164.39 |
£328.78 |
1.72% |
East Riding of Yorkshire Council |
126 |
3 |
£632.00 |
£1,896.00 |
2.38% |
Dorset Council |
239 |
4 |
£246.38 |
£985.52 |
1.67% |
Gloucestershire County Council |
602 |
10 |
£214.70 |
£2,147.00 |
1.66% |
Herefordshire Council |
223 |
17 |
£556.65 |
£9,463.05 |
7.62% |
Nottinghamshire County Council |
1,228 |
25 |
£399 |
£9,975.00 |
2.04% |
Central Bedfordshire |
748 |
27 |
£222.22 |
£5,999.94 |
3.61% |
Cornwall Council |
315 |
35 |
£237.86 |
£8,325.10 |
11.11% |
SuffolkCounty Council |
348 |
71 |
£222.35 |
£15,786.85 |
20.40% |
Kent County Council |
1645 |
86 |
£192 |
£16,512.00 |
5.23% |
NorfolkCounty Council |
471 |
98 |
£334.00 |
£32,732.00 |
20.81% |
West Sussex County Council |
1045 |
108 |
£299.88 |
£32,387.04 |
10.33% |
Warwickshire County Council |
422 |
114 |
£388.00 |
£44,232.00 |
27.01% |
Westmorland and Furness Council |
492 |
133 |
£310.72 |
£41,325.76 |
27.03% |
Derbyshire County Council |
471 |
150 |
£237.92 |
£35,688.00 |
31.85% |
Hampshire County Council |
1,212 |
152 |
£257.11 |
£39,080.72 |
12.54% |
Hertfordshire County Council |
1852 |
181 |
£352.81 |
£63,858.61 |
9.77% |
East Sussex County Council |
1805 |
196 |
£385.00 |
£75,460.00 |
10.86% |
Lincolnshire County Council |
1558 |
223 |
£207.12 |
£46,187.76 |
14.31% |
Devon County Council |
1,311 |
239 |
£192.00 |
£45,888.00 |
18.23% |
Cambridgeshire County Council |
1789 |
244 |
£271 |
£66,124.00 |
13.64% |
Surrey County Council |
3,354 |
257 |
£389.61 |
£100,129.77 |
7.66% |
Staffordshire County Council |
1867 |
258 |
£226.25 |
£58,372.50 |
13.82% |
Oxfordshire County Council |
1416 |
285 |
£203 |
£57,855.00 |
20.13% |
Wiltshire Council |
973 |
408 |
£233.56 |
£95,292.48 |
41.93% |
Want the latest car news in your inbox? Sign up to the free Auto Express email newsletter…
Source: Read Full Article